|
 Where the Redwoods Are Where the Redwoods Are
The natural distribution of coast redwood is particularly interesting because it occurs within a relatively narrow belt largely near the coast of central and northern California. This distribution is thought to be greatly reduced from that of the Tertiary as coast redwood-like fossils occur in scattered locations across the West. It is because of this long-term range reduction that coast redwood is sometimes referred to as a "relict species".
Along the coastal belt, there is great variation in where redwood occurs today (right). These broad patterns of presence and absence provide insight into the environmental conditions that favor redwood over its competitors.
The margins of the redwood range are rarely abrupt. Toward the north, the inland east and especially in the dryer south, redwood becomes restricted to the most protected portions of the landscape -- riparian areas and lower slopes. These populations often form outliers that are separated from the main body of forest by kilometers. As temperature varies least toward the coast, it is notable that some of the most impressive redwood forests are farthest from the coast, as is evident along the alluvial terraces of Humboldt Redwoods State Park and Mendocino Woods State Natural Reserve.
These peculiarities of the coast redwood range fascinated early naturalists. They explained the coastal preference of redwood by the frequency of fog, and many argue as much today. During the last three decades, research indicates that there is a general correspondence of coast redwood forests and coastal fog-stratus cover, but the present-day pattern of fog-stratus provides only a modest predictor for the overall outlines of the species range. Given how fog-stratus cover has varied during the last century and a half of record keeping and how resilience sprouting redwood seems to be at millennial time scales, this partial incongruity should come as no surprise.
What other factors may influence the coast redwood range? Over the years, many have noted the increased precipitation found along the northern California coast, but the heaviest rainfall comes during the winter months when moisture is not in short supply. The length of the rainy season makes a better argument, as it limits the duration of the summer drought stress and the potential for severe fire.
Minimum and maximum temperatures are also traditional explanations for plant distributions. Only northern high-elevation redwood forests experience ice storms and snow on a regular basis, and they seem to thrive with moderately cold temperatures. More interior sites experience even colder winter temperatures, but they also experience high summer temperatures that may be a more critical stressor that prevents redwood from thriving. Even near the coast, the importance of redwood declines on dryer slopes.
Yet on the coast, the importance of coast redwood on different slope exposures (i.e., aspect, slope position) may just as easily reflect historic fire behavior, not simply temperature directly. Frequent and/or hot fire on dry slopes may favor competing shrubs and seeding trees over redwood. This is a fascinating hypothesis because the importance of human fires has varied over the centuries, and the range of redwood may have been in retreat due to a increase in human burning over the last millennium in particular.
As is the case with other species, the coast redwood range correlates with a number of factors. In a general sense, climate is clearly important, but mechanistic explanations for which climatic variables are important and why are masked by environmental complexity and the peculiar disturbance history of the region.
Mapping the Redwood
 When Charles Sargent first created his generalized map of the coast redwood forest in 1881 (right), it was to understand coast redwood as a resource for logging. Then, only a small part of the redwood had been cut over, but within a few decades, forward thinking individuals began to worry about regeneration. Professionals argued that the failure of stands to regenerate was widespread because of repeated fires. Both the lumber industry and the public knew that bust-boom logging cycles were always a threat, and redwood's remarkable potential for regeneration by sprouting provided hope that the story would be different here. When Charles Sargent first created his generalized map of the coast redwood forest in 1881 (right), it was to understand coast redwood as a resource for logging. Then, only a small part of the redwood had been cut over, but within a few decades, forward thinking individuals began to worry about regeneration. Professionals argued that the failure of stands to regenerate was widespread because of repeated fires. Both the lumber industry and the public knew that bust-boom logging cycles were always a threat, and redwood's remarkable potential for regeneration by sprouting provided hope that the story would be different here.
About the same time that early foresters were raising their red flags, conservationists began to take interest in the redwood forests as well. New roads opened areas to logging for the first time, and these roads brought tourists who were willing to travel far just to see something superlative, provided that some trees remained standing. The founders of Save The Redwoods League, needed to know where redwood occurred and where active logging might make preservation efforts of the best stands more urgent.
How much redwood forest had been cut over? How much was left? Was regeneration happening? Where were the most superlative ancient stands that could be protected? To answer these questions, everyone needed a good map.
Two new maps were generated during the early 20th century, and they are remarkable because of their differences with each other and Sargent's earlier map. The first was published in 1919 by Madison Grant, an original member of the Executive Committee of Save The Redwoods League. Grant's map (below) showed a large number of outlying stands, many of which are not recognized today. No map since has portrayed so many large outliers, although Griffin and Critchfield's 1972 atlas comes close (see link below).
 Some of these outliers may have been represented by only a few trees, some may now be gone entirely, and many may have simply been mistakes. Because of the small scale of this map, it is difficult to always know which is true. Grant's most interesting groves are the elongated tracts mapped along the eastern edge of the range in Mendocino County. He also reduced the extent of coast redwood east of San Francisco Bay compared to Sargent's earlier map, but correctly widened it in Mendocino and Sonoma Counties. Perhaps most importantly, he was the first to show discontinuities or breaks in the coast redwood distribution, and his map gives a visual impression of a fragmented forest; a truth which was consistent with his argument for conservation. Some of these outliers may have been represented by only a few trees, some may now be gone entirely, and many may have simply been mistakes. Because of the small scale of this map, it is difficult to always know which is true. Grant's most interesting groves are the elongated tracts mapped along the eastern edge of the range in Mendocino County. He also reduced the extent of coast redwood east of San Francisco Bay compared to Sargent's earlier map, but correctly widened it in Mendocino and Sonoma Counties. Perhaps most importantly, he was the first to show discontinuities or breaks in the coast redwood distribution, and his map gives a visual impression of a fragmented forest; a truth which was consistent with his argument for conservation.
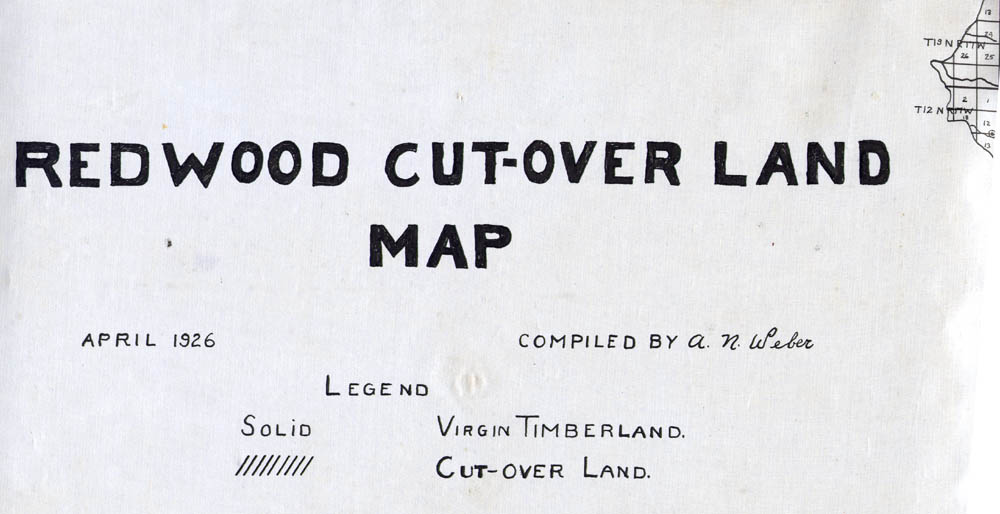
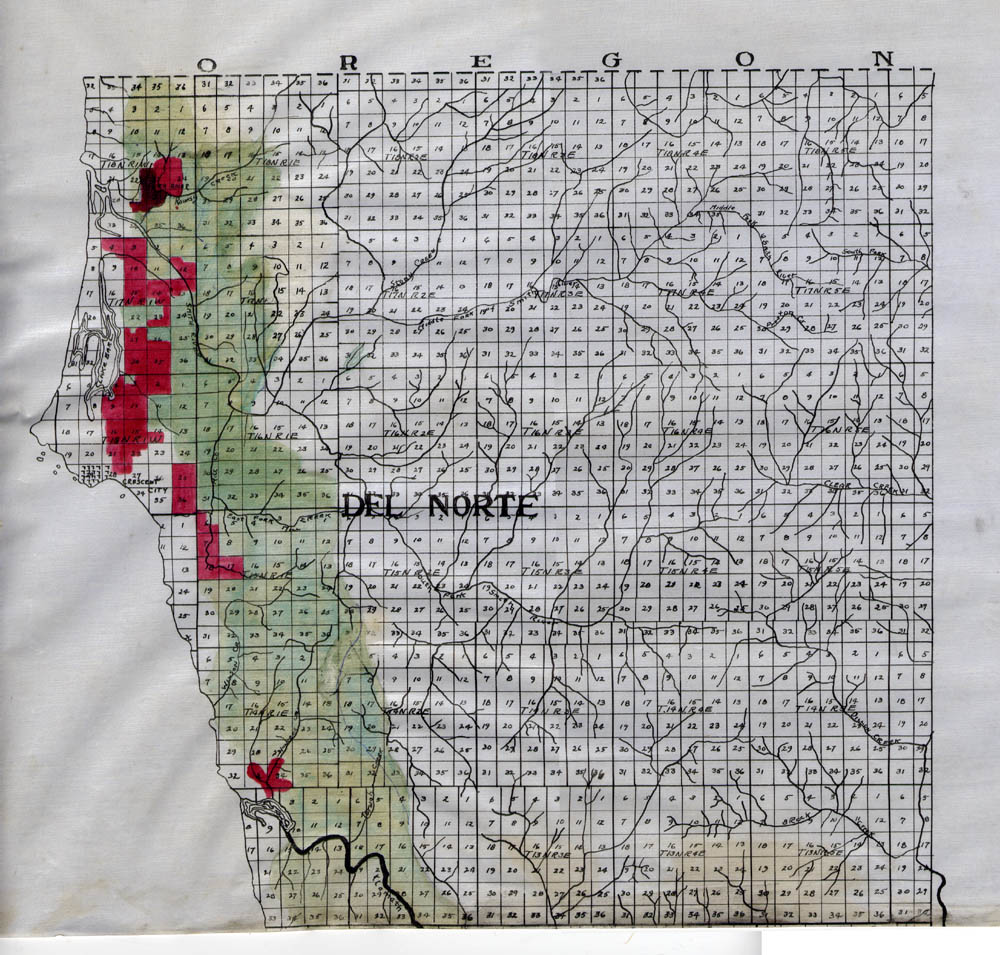
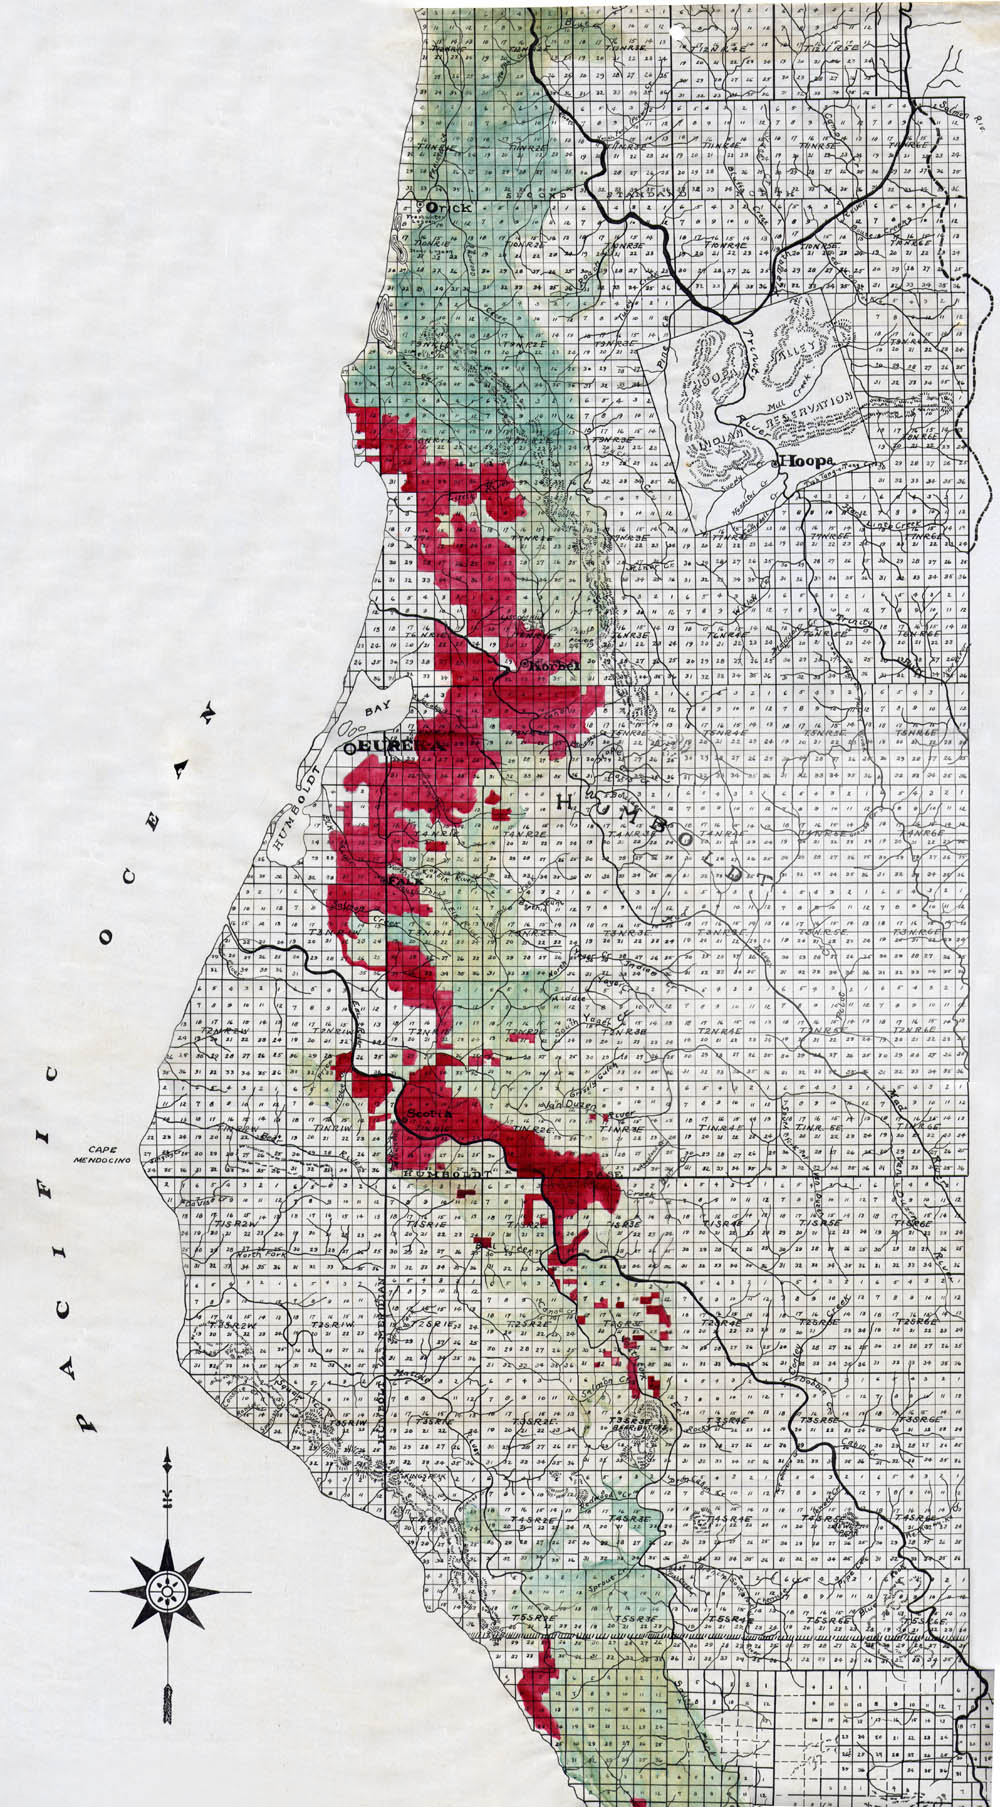
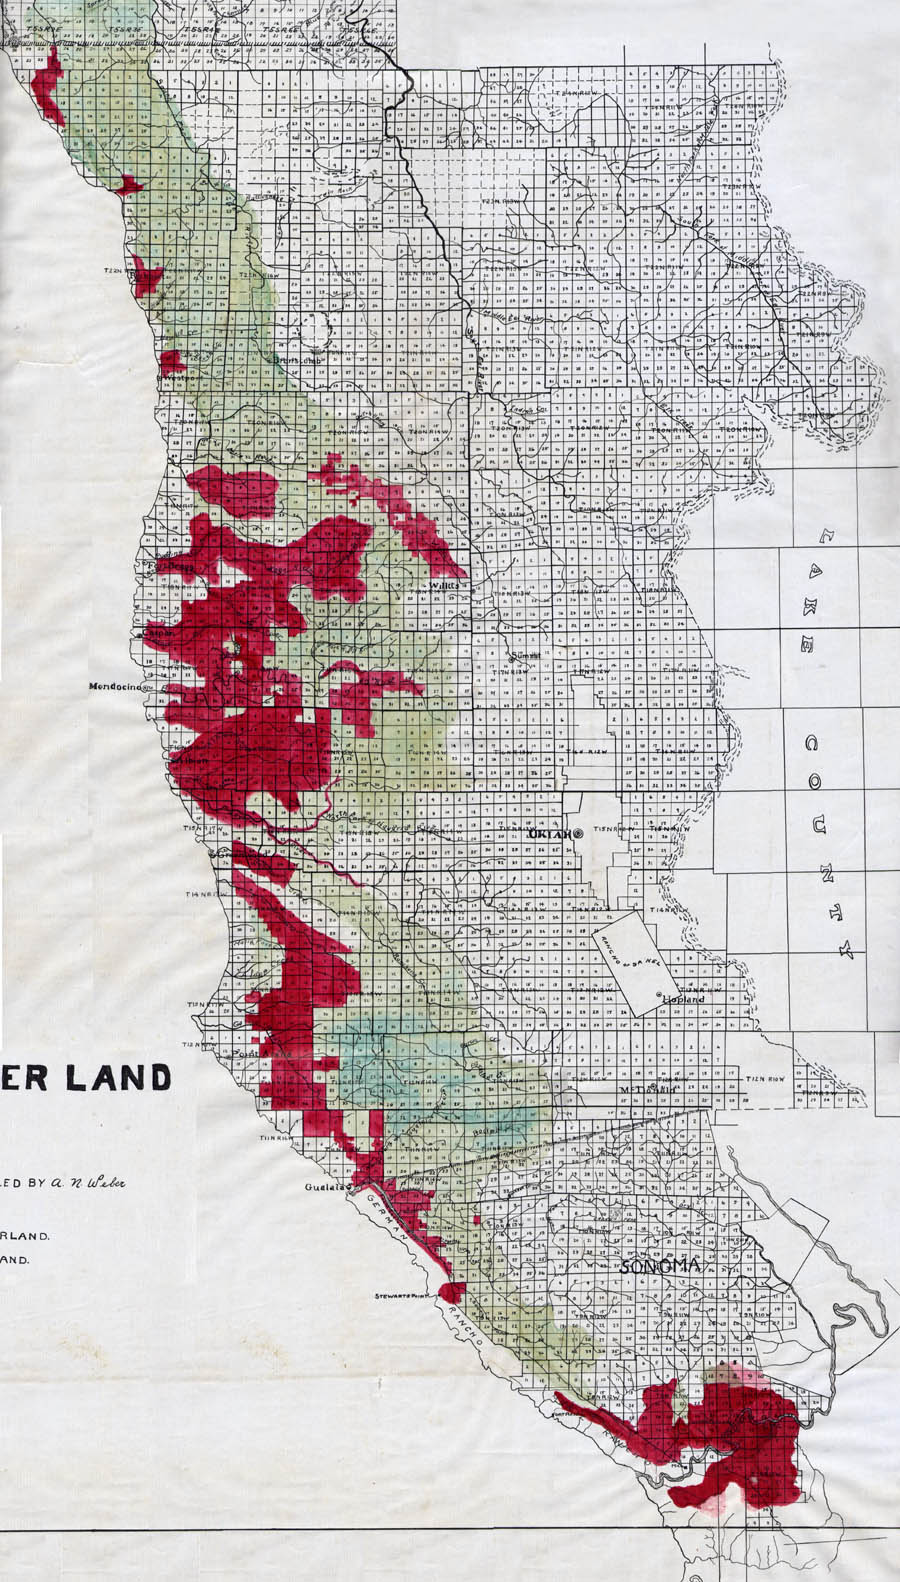
Within the decade, A.N. Weber produced a different map that detailed the redwood range north of San Francisco. As did Sargent, Weber distinguished areas that had been logged and unlogged with painstaking detail.
Weber drafted his map using a surveyor's base map with one mile square sections. Apart from the question of accuracy in the days before aerial photographs were available, his attempted level of precision provides us with a clear view of where he thought redwood forests were and where extensive lumbering activity had taken place during prior decades (below).
What I find most remarkable about Weber's map, particularly in light of Grant's effort of the prior decade, is that despite the potential for detail, Weber shows very few of Grant's outliers, even those accepted half a century later by Griffin and Critchfield in their revisionist map. It seems that Weber was more interested in the silvicultural potential of redwood forests than the species' actual distribution from a biogeographical perspective, and he says as much in his accompanying report. Eastern outliers, just like those forests south of San Francisco Bay, were unmapped because they were of less commercial concern.
 So how accurate was Weber near the coast where redwood was often the dominant species? Logged redwood stumps that still exist provide definitive evidence for where the trees occurred. Around Humboldt Bay, Weber's mapping of logged areas is often a quarter mile or more off from what we know to be true based on stump observations. More remote locations are likely to be even less accurate. So how accurate was Weber near the coast where redwood was often the dominant species? Logged redwood stumps that still exist provide definitive evidence for where the trees occurred. Around Humboldt Bay, Weber's mapping of logged areas is often a quarter mile or more off from what we know to be true based on stump observations. More remote locations are likely to be even less accurate.
The Weber map's historical value is that it provides us with insights into the progress and distribution of logging on the coast in the early 20th century when timber and conservation interests first came to a head.
Such cartographic knowledge put the restricted natural extent of the redwood range and the much smaller extent of preserved stands in stark context. It also helped non-government agencies and government officials develop strategies for their mid-century acquisition of redwood lands with the hope of improving forest management and it eventually assisted in development of the range-wide state and national redwood park system.
Today, we want to know where the coast redwood are and were for different reasons. Populations on the edge are thought to be highly sensitive to environmental changes, such as logging, fire exclusion and climate change. By understanding the distribution and density of redwood across its range and how it has varied over time, we gain powerful insights into why, how and where redwood are likely to thrive in the future.
_____________
Steve Norman
|
|


